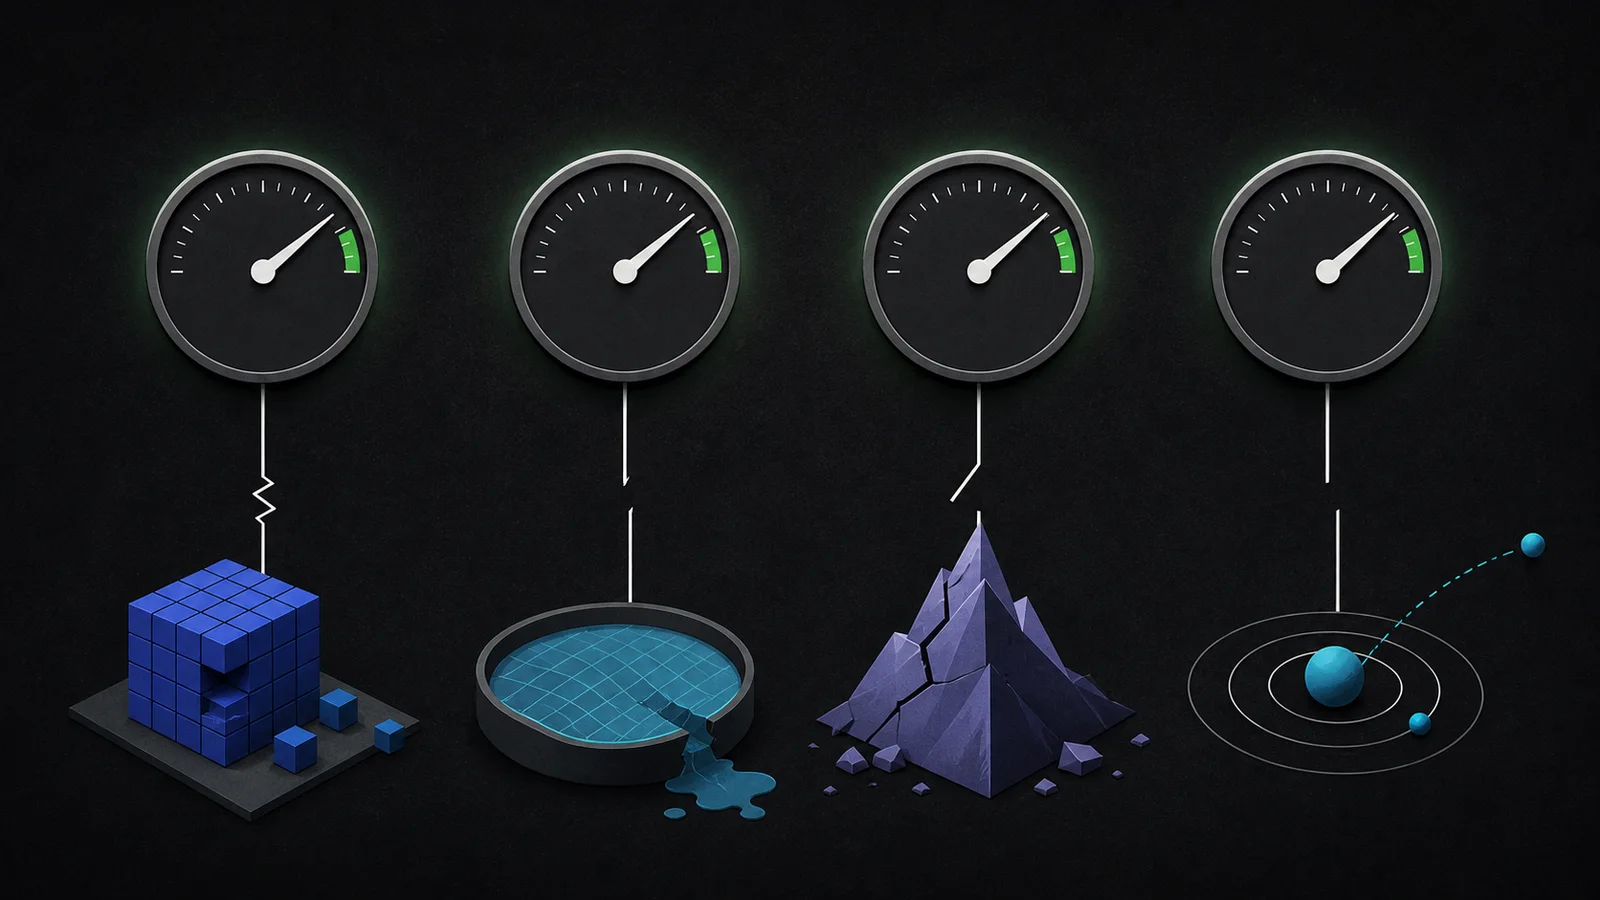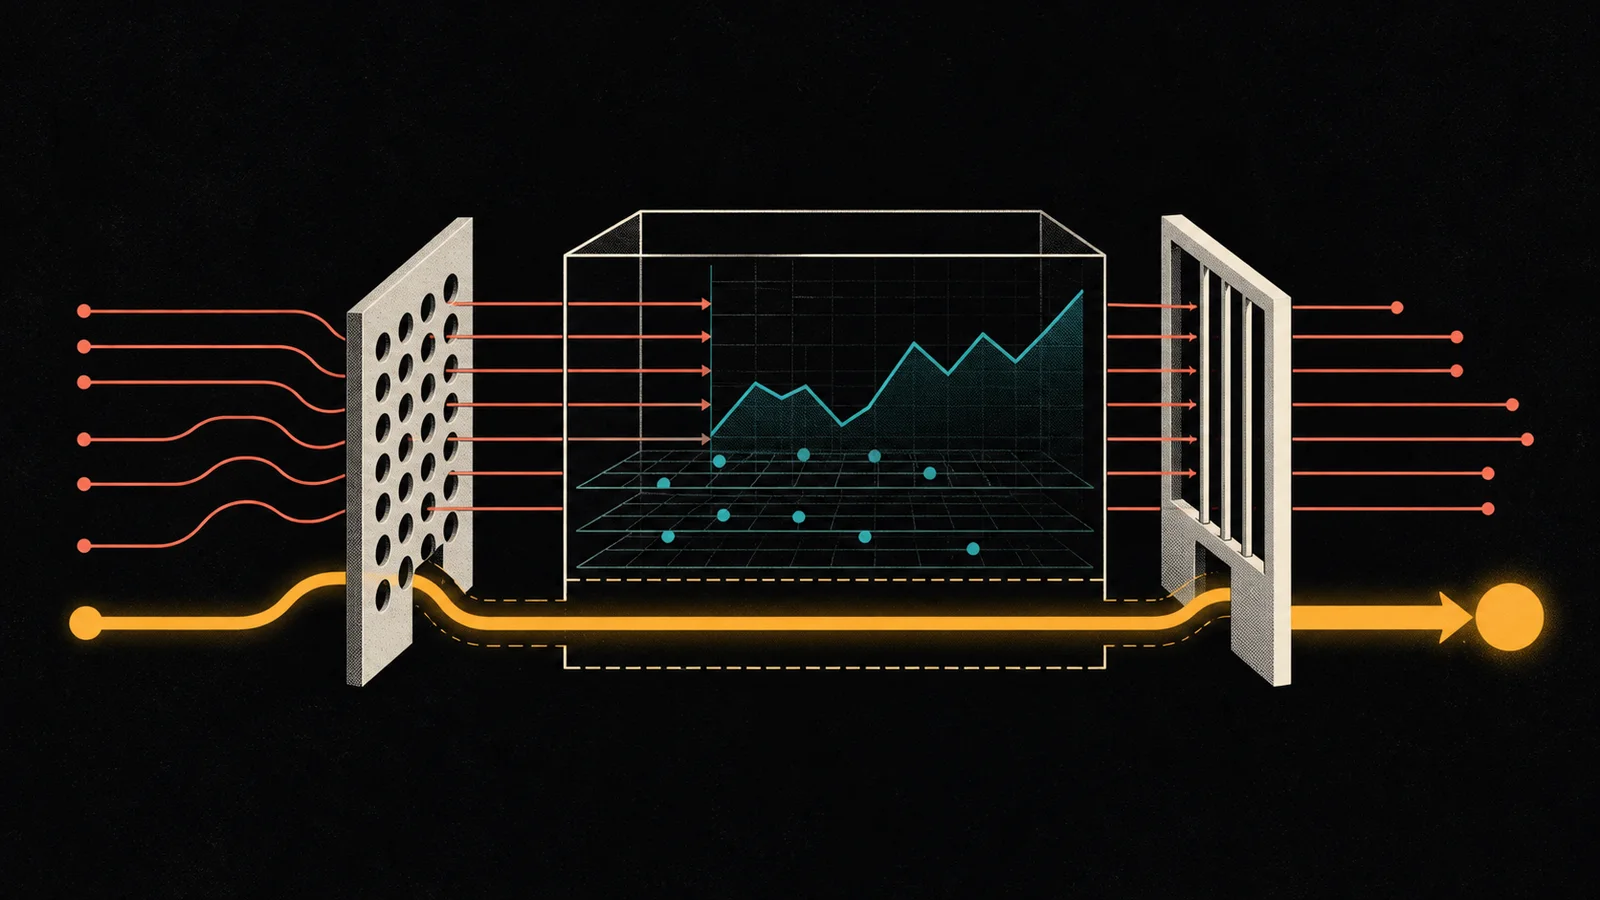
We asked AWS what AWS cost. AWS charged us $229.35 for the questions.
Our dashboard showed $16.67 over 30 days in ordinary resource costs. The July bill showed $229.35 for Cost Explorer alone. At one cent per API request, that is roughly 22,935 calls to GetCostAndUsage.
The visible progression was simple:
$16.67 of infrastructure
        -> $229.35 of automated cost checks
        -> 13.7× the number on screen
We rounded the headline in our favor.
Then came the better joke: the dashboard could not see the charge created by running the dashboard.
We did not catch it. A manual read of the vendor bill did.
The filter had a blind spot shaped exactly like itself
Our AWS account contains resources for more than one project, so the dashboard filtered costs by a project tag:
cost belongs to project
  if resource.tags["Project"] == project_name
That works for virtual machines, object storage, and container registries. They are resources. Resources can carry tags.
An API request fee is not a project resource. It has nothing to tag. AWS documents that some service charges cannot be tagged at the resource level, which means a resource-tag query cannot return the cost of running that query.
The dashboard did not forget a row. The row was disqualified before the answer existed.
We replaced the rule with two explicit buckets:
attributed cost = tagged resources
                OR audited untaggable services attributed to us
The tag filter stays. Removing it would pull in other projects. Instead, a narrow allowlist covers untaggable services only when we can explain why their charge belongs to us. Every result now carries its attribution basis and its untaggable subtotal. If that basis is unknown, the dashboard says incomplete instead of dressing the number up as a total.
Cost attribution is a claim. The claim needs to travel with the number.
Our cache had three personalities
The next suspect was caching. The code already had four keys and a six-hour TTL, which sounds reassuring right up until the environments introduce themselves:
- Production used a shared persistent cache.
- Test used a null cache. Every read was a miss by design.
- Development used per-process memory. Every one-shot command woke up with amnesia.
Same code. Three completely different definitions of “cached.”
Production page loads were not enough to explain the bill. Tests and one-shot commands could still call AWS from cold processes. CI systems often have cloud credentials; an unstubbed test can become a tiny purchasing bot with excellent attendance.
The bill averaged about 740 calls per day in July, then about 131 per day from August 1 through August 5 before the full fix landed. The environment split explains how calls escaped the production cache. It does not explain that drop, so we are not inventing an explanation for it.
Dashboard reads no longer shop
“Cache the API call” was the wrong boundary. We replaced it with a simpler rule:
Reading the dashboard must never buy anything.
One scheduled job owns the daily refresh. It writes a durable last-known-good snapshot. The dashboard and briefing only read that snapshot and show when it was fetched.
A deploy, eviction, or cold process can now make the number stale. It cannot turn curiosity into another purchase.
Outside the production refresh path, Cost Explorer access is disabled unless someone deliberately opts into a diagnostic call. Tests also reject that network access even if application code slips around the first gate. The cache remains useful, but it is an optimization behind the boundary rather than the boundary itself.
If the meter breaks, stop spending
Operational checks usually fail open. If a monitoring probe breaks, it should not take the system down with it.
A spend ceiling is the opposite. The guarded action is the expensive part. If the budget ledger is unreadable, continuing to call AWS is not resilience. It is an unlimited tab with an error message.
Every request now claims a unit in a persistent daily ledger before opening the network connection:
budget healthy       -> claim, then call
budget spent         -> stop
budget unreadable    -> stop
provider unavailable -> serve last-known-good
The ledger records the environment, caller, time, and outcome. A crashed process may leave a pending row, but the counter cannot understate how many calls it authorized. Freshness gets a separate alarm based on snapshot age. “The data is stale” and “the dashboard is spending again” deserve different sirens.
We checked the checker once
We did not trust the new ledger merely because it looked calmer. That would be giving the replacement dashboard the same benefit of the doubt as the old one.
On August 6, AWS billed $0.05: five requests. Our ledger recorded the same five, four scheduled refreshes and one deliberate verification query. We opened both read surfaces between checks. The count stayed put.
We paid five cents to verify that asking about the bill had finally stopped changing the bill.
This incident sits next to cost per completed task, but one layer earlier. That post asks whether usage produced useful work. This failure asks whether the meter can represent its own appetite.
The rule we kept is short:
For every cost report, write down what its filter can never match. Then check whether running the report lives in that gap.